-2.jpg?width=240&height=83&name=Menu-Banner%20(5)-2.jpg)
.jpg?width=240&height=83&name=Menu-Banner%20(8).jpg)


Data Quality - Overview
Data Quality is the process of understanding the quality of data attributes such as data types, data pattern, existing values, and so on. Data quality is also about capturing the score of an attribute based on some specific constraints. For example, get the count of records for which the attribute value is NULL, or find the count of records for which a date attribute does not fit into the specified Date Pattern.
Managing your Data Quality
This means that we can weigh the quality of data to any extent irrespective of the available data being good or bad. This Data Quality report can be captured with the complete data details, at record level or even at the attribute level. Using this report, business can identify the quality of data and make out how it can be used to help / benefit the customer. A plan can also be worked out to enhance the quality of data by applying business rules and correcting the required information based on the business needs.
This blog post aims at bringing out the significance of data quality, data quality report generation, steps involved in automation of the data quality report using the scheduler feature of Informatica IDQ.
Deriving Quality Data
We have tools in the market to generate these Data Quality reports based on the input data we provide with configuration of some business specifications. An important solution provider in the market for Data Quality report generation is Informatica IDQ which is formulated to generate profiling reports and Data Quality reports.

Figure 1: Data Quality Tools
Profiling the input data
By profiling the raw input data, the different features of the data like distinct values including count of NULL values, distinct patterns available, and all possible datatypes can be inferred. By specifying some condition, data satisfying that condition can be filtered and Data Quality report can be generated highlighting these records.
Validating DQ dimensions
The different Data Quality dimensions like Completeness, Conformity, Consistency, Accuracy, Duplication and Integrity can be validated using these tools. Using the Distinct Values report, the count of duplicate entries for the different values of each attributes can be inferred. We can also retrieve the conformity percentile of each attribute to infer the column suitable for becoming a primary key candidate. Also, the consistency of the data can be analyzed using the Pattern Report generated.
Data Quality Implementation Process
With the background of the need and requirement of Data Quality report defined, we move on to implementing it in the best possible way. Consider we have implemented a Data Quality solution and the package is available in hand.
Can we give a sign off for this component at this stage? No, we have lot more steps to implement over this code to get the desired solution. We need a responsible person to trigger the code based on need (either daily or weekly) and a person to monitor the results generated and an Administrator for technical support.
What if all these processes are automated and the results are available in a single place so that we have no dependency on any of these persons?

Figure 2: Automation
Informatica IDQ Scheduler Automation Process
Using the scheduling feature of Informatica IDQ, we can deploy the solution as a package in Informatica Console. We can also schedule the run time of the code for each day of the week based on our need in advance. The biggest advantage of this approach is that we can schedule the run time and the code also need not be triggered manually. Based on the daily schedule, the code is automatically triggered, and results are generated.
The run logs are also available in the Informatica Console which can be configured to be sent as email for each run. Using this approach, once implemented and deployed in the Informatica Console, no manual intervention is needed. The implementation is run as per schedule automatically and the run statistics are available as email notification once the process is complete on a daily basis.
Benefits
Minimal Efforts are required for:
- Execution
- Results Monitoring
End to End Approach
It is an approach which covers all possible scenarios in a process and provides a valid solution for each business case occurrence during the execution. Using such an approach, the customer can get the Data Quality in an automated way thereby avoiding the overhead of having a large team to maintain these Data Quality programs. Because once the process is complete, the results are readily available to the customer in a file and the results are also captured in a table.
In case of failure, an email notification is sent to the customer with the failure reason when the code breaks in the middle at any point before completion.
Figure 3: End to End Process
Process Flow Control
To automate the flow to run from the exact point where the execution finished in the previous run, an AUDIT table is introduced. In this AUDIT table, the current run Status is captured and used for the next run. Using this approach, customer need not worry about loss of data or mismatch of data attributes as the data extraction is controlled by the AUDIT table.
The process makes an entry in AUDIT table with Status as 'IN PROGRESS' for each run. Once the run is complete, the Status is updated to 'COMPLETE' for that run. If any problems occur during the run, Status is updated to 'FAILED' and the run is aborted.
We can see how this Status value of the current run helps in the execution of the Next run. When the next run is automatically triggered as per schedule, the code checks the AUDIT entry of the previous run. If the Status is 'COMPLETE', the previous execution is successful and the Profiling and Data Quality processes of the current run are triggered. If the Status is 'IN PROGRESS', this means the previous run is still not complete because of some reason. In this case, the current run goes in a loop checking the Status on a timely basis. Only when the Status of previous run is updated to 'COMPLETE', the current run is triggered.
Until the Status of previous run is updated, this execution goes in a loop so that the previous run's data is not disturbed by the current run. If the Status is 'FAILED', the AUDIT table is updated with 'FAILED' Status for the current run also and the execution is terminated. In this way, the code is never run until the issue is resolved. This feature is helpful in saving the resources and time for execution because the same issue of failure will happen in all the runs.
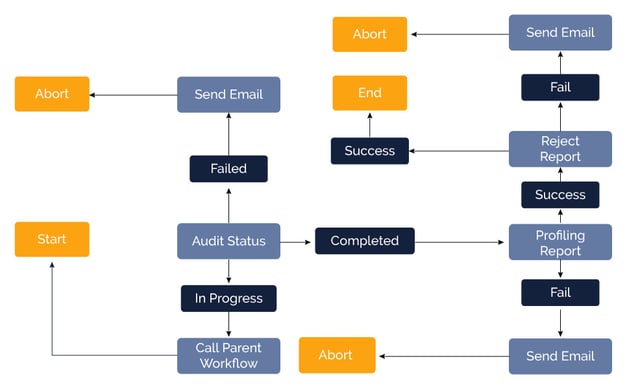
Figure 4: Process Flow
Report Generation
The Data Quality report is also captured at the finest levels for the customers to understand the data completely. The level of auditing is done at attribute level, i.e., for each attribute the Failure or Reject count and Failure percentile are captured and reported. In this way, the customer can understand the impact of the total quality of data relative to every attribute. After understanding this report, the user can focus more on correcting the attributes with more failures easily.
Another Audit report is also generated which includes the count of each reject reason. In this report, the count of records captured for each rule defined is available. This report is beneficial for the business to understand and improvise on the defined Data Quality rules.
Conclusion
Using the IDQ Automation process, the customer holds complete control of the system by receiving high quality and reliable results. Also, the dependency on external resources for initiating the process and monitoring the process can be avoided, thereby saving time and money.